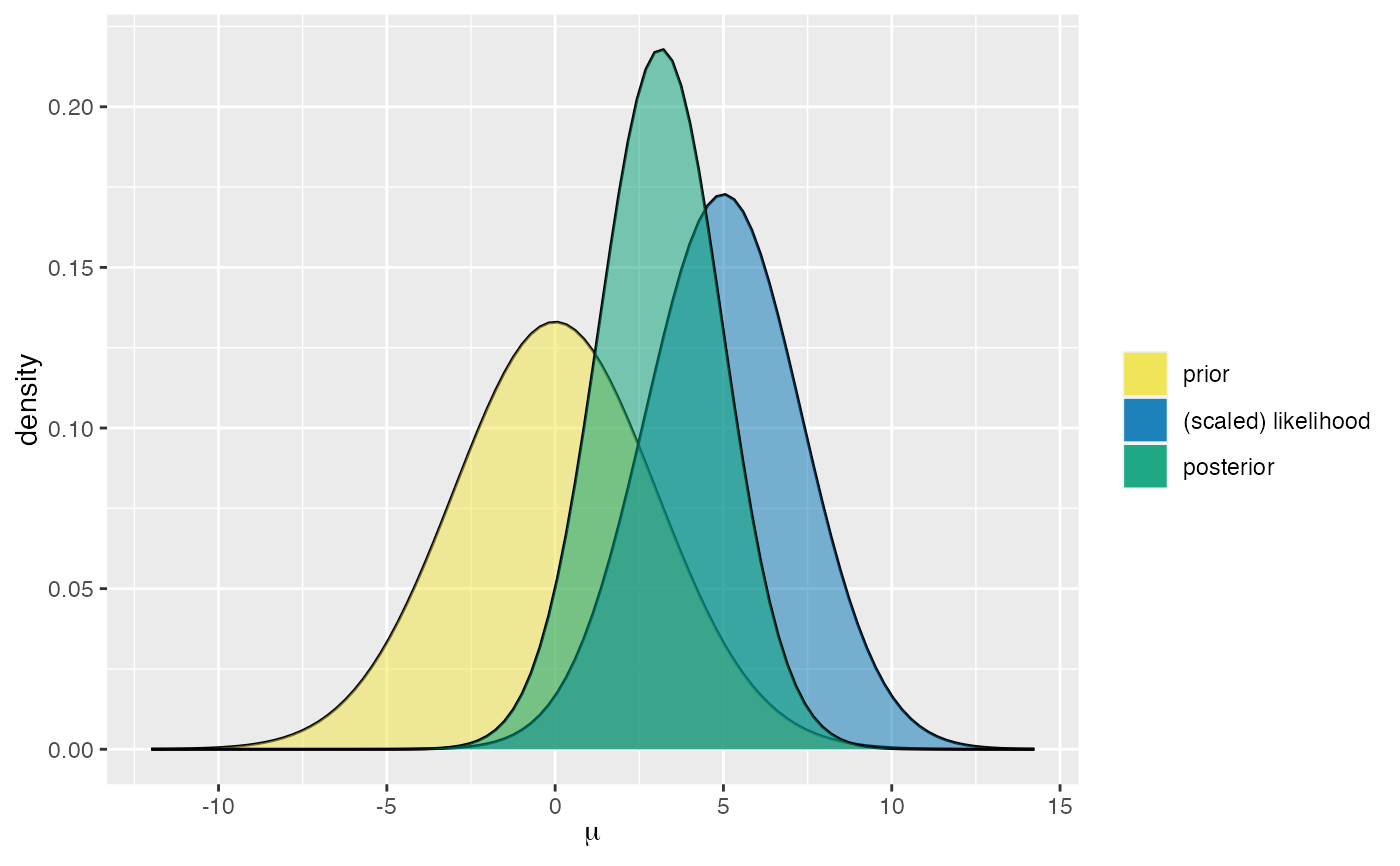
Consider a Normal-Normal Bayesian model for mean parameter \(\mu\) with a N(mean, sd^2) prior on \(\mu\) and a Normal likelihood for the data. Given information on the prior (mean and sd) and data (the sample size n, mean y_bar, and standard deviation sigma), this function produces a plot of any combination of the corresponding prior pdf, scaled likelihood function, and posterior pdf. All three are included by default.
plot_normal_normal(
  mean,
  sd,
  sigma = NULL,
  y_bar = NULL,
  n = NULL,
  prior = TRUE,
  likelihood = TRUE,
  posterior = TRUE
)
Arguments
- mean
mean of the Normal prior
- sd
standard deviation of the Normal prior
- sigma
standard deviation of the data, or likelihood standard deviation
- y_bar
sample mean of the data
- n
sample size of the data
- prior
a logical value indicating whether the prior model should be plotted
- likelihood
a logical value indicating whether the scaled likelihood should be plotted
- posterior
a logical value indicating whether posterior model should be plotted
Value
a ggplot
Examples
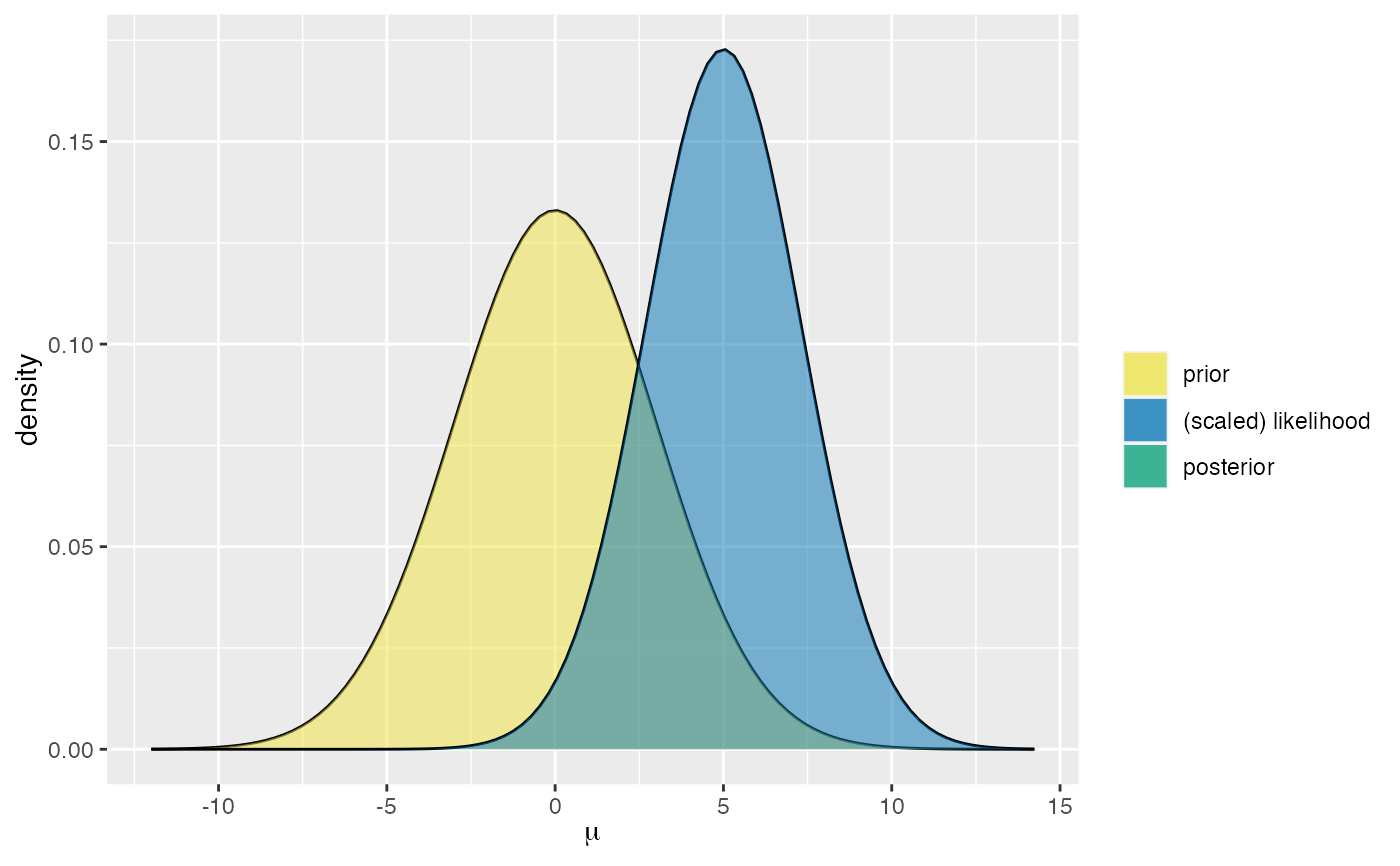
plot_normal_normal(mean = 0, sd = 3, sigma= 4, y_bar = 5, n = 3)

plot_normal_normal(mean = 0, sd = 3, sigma= 4, y_bar = 5, n = 3, posterior = FALSE)