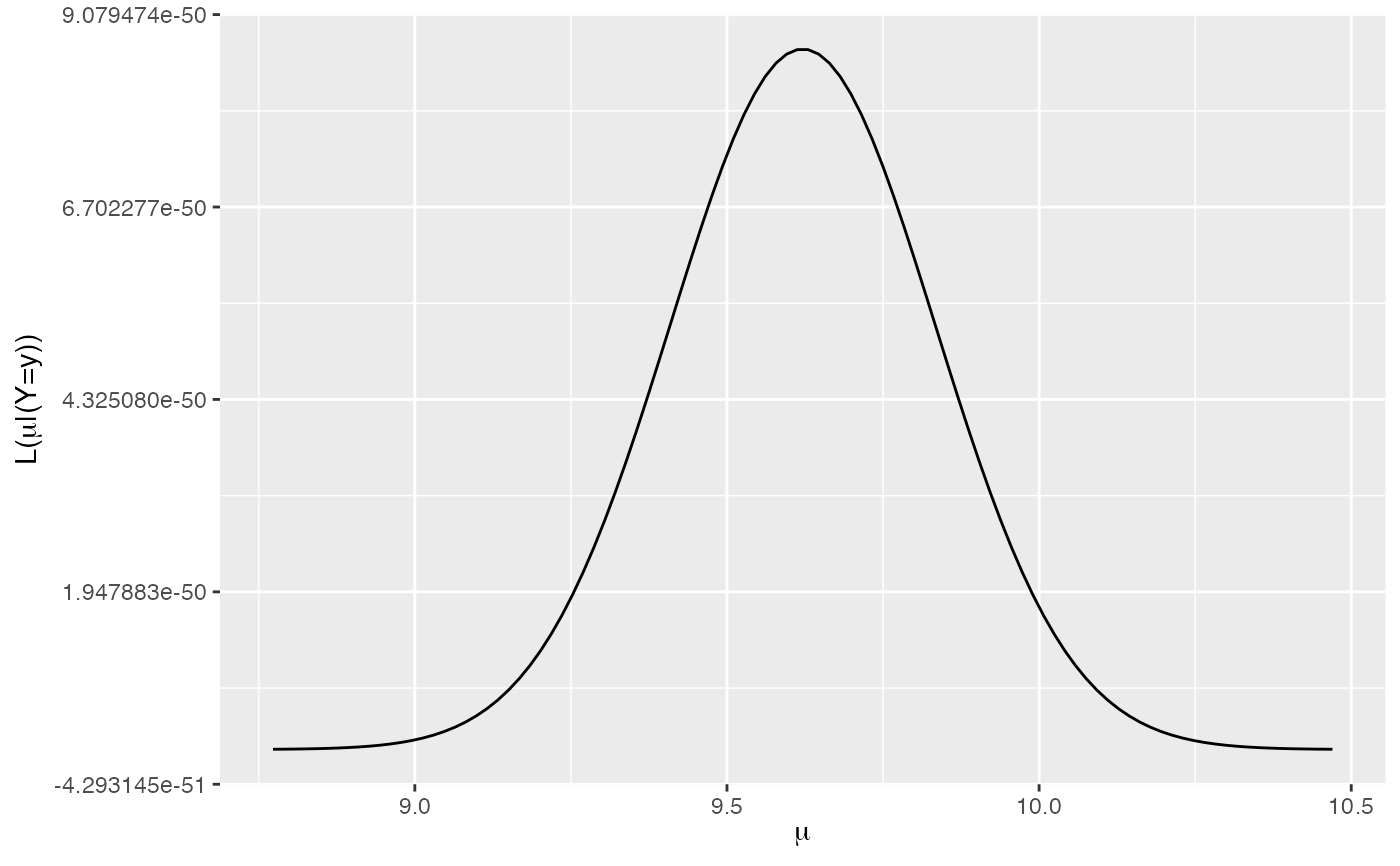
Plots the Normal likelihood function for variable \(\mu\) given a vector of Normal data y.
plot_normal_likelihood(y, sigma = NULL)Arguments
Value
a ggplot of Normal likelihood
Examples
plot_normal_likelihood(y = rnorm(50, mean = 10, sd = 2), sigma = 1.5)