Plots the probability density function (pdf) for a Normal(mean, sd^2) model of variable \(\mu\).
plot_normal(mean, sd)Arguments
Value
a ggplot
Examples
plot_normal(mean = 3.5, sd = 0.5)
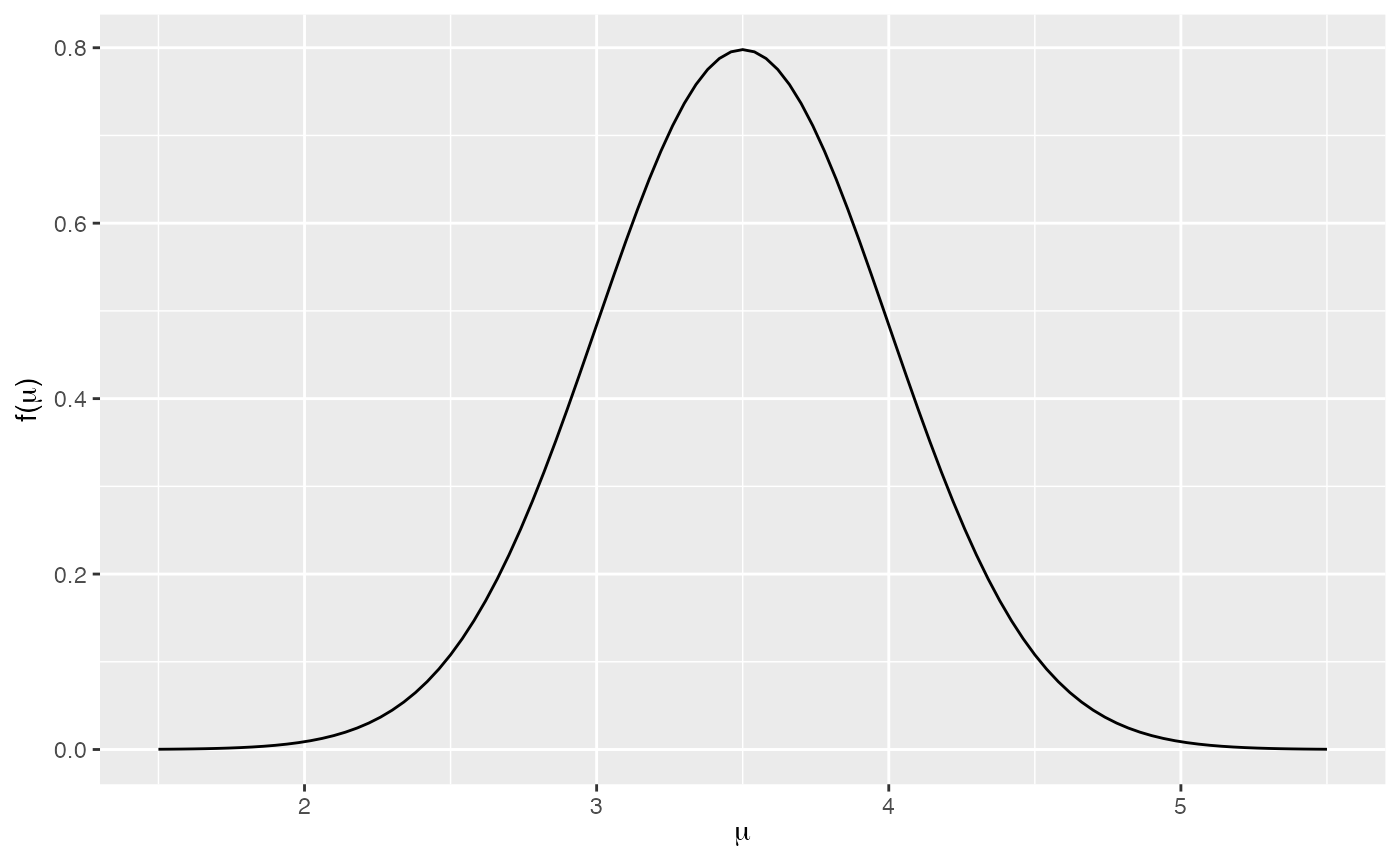
Plots the probability density function (pdf) for a Normal(mean, sd^2) model of variable \(\mu\).
plot_normal(mean, sd)a ggplot
plot_normal(mean = 3.5, sd = 0.5)