Plot a Binomial Likelihood Function
Source:R/plot_binomial_likelihood.R
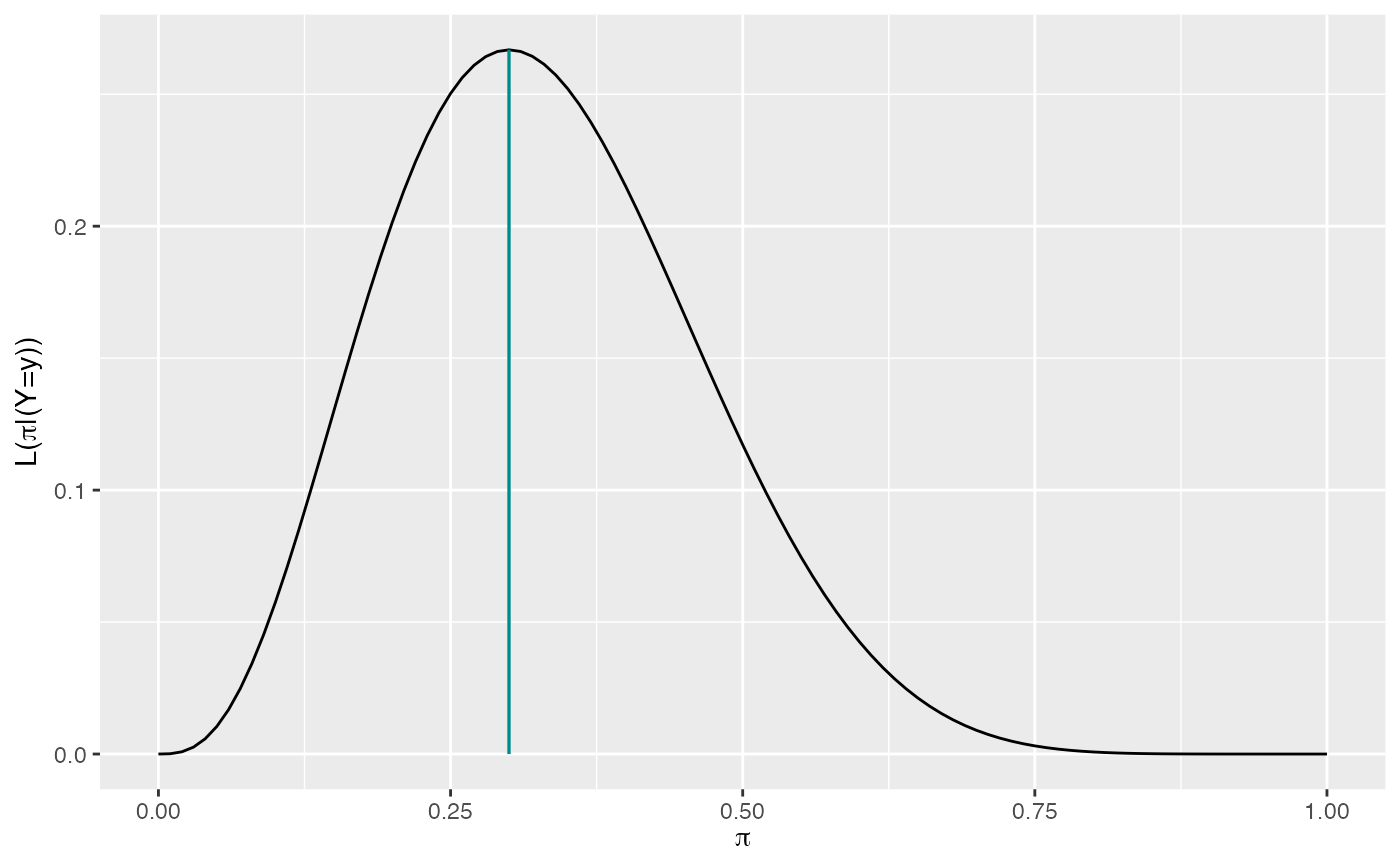
plot_binomial_likelihood.RdPlots the Binomial likelihood function for variable \(\pi\) given y observed successes in a series of n Binomial trials.
plot_binomial_likelihood(y, n, mle = FALSE)Arguments
Value
a ggplot
Examples
plot_binomial_likelihood(y = 3, n = 10, mle = TRUE)
#> Warning: All aesthetics have length 1, but the data has 2 rows.
#> ℹ Please consider using `annotate()` or provide this layer with data containing
#>   a single row.