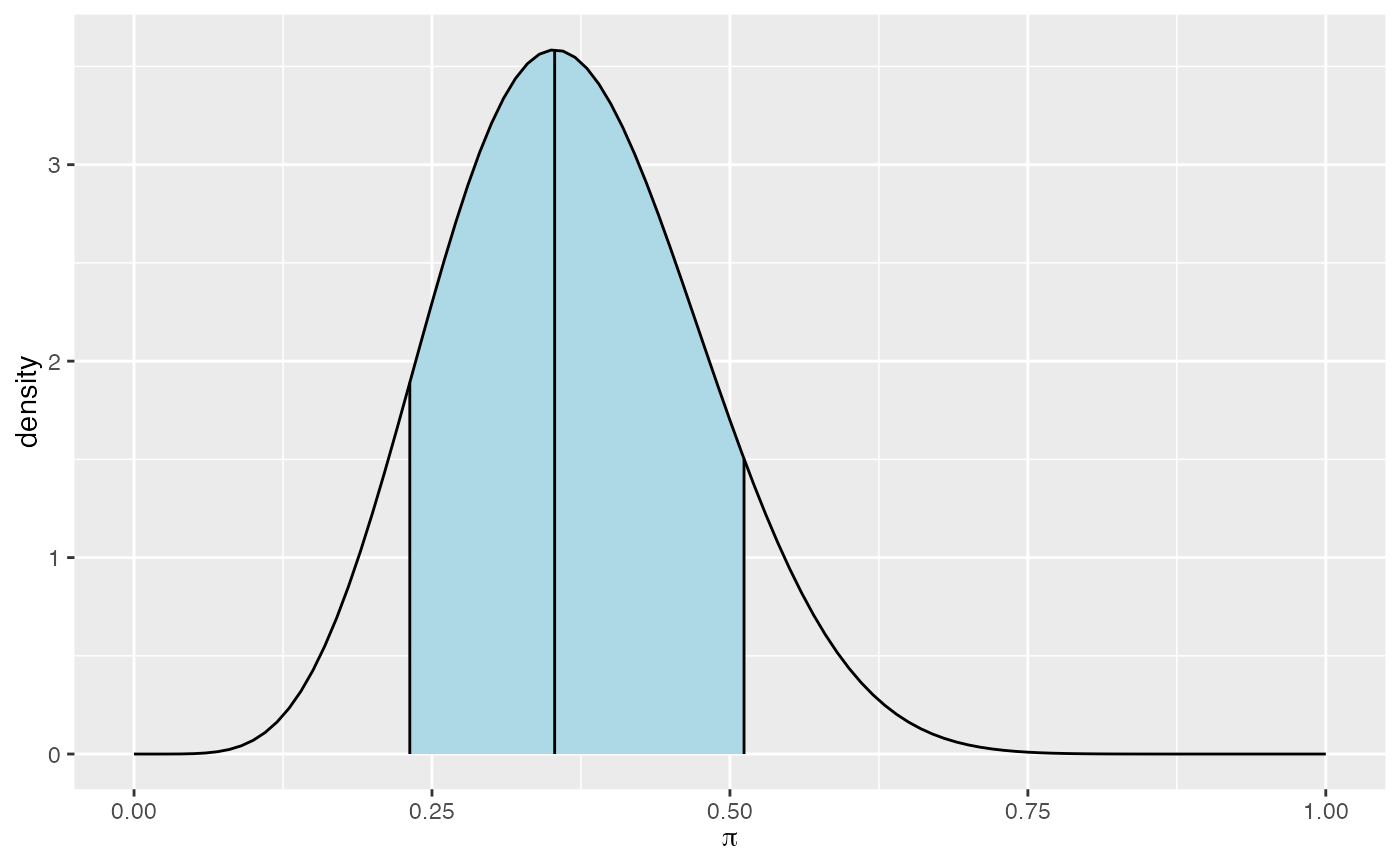
Plots the probability density function (pdf) for a Beta(alpha, beta) model of variable \(\pi\) with markings indicating a credible interval for \(\pi\).
plot_beta_ci(alpha, beta, ci_level = 0.95)Value
A density plot for the Beta model
Examples
plot_beta_ci(alpha = 7, beta = 12, ci_level = 0.80)