Plots the probability density function (pdf) for a Beta(alpha, beta) model of variable \(\pi\).
plot_beta(alpha, beta, mean = FALSE, mode = FALSE)Arguments
Value
A density plot for the Beta model.
Examples
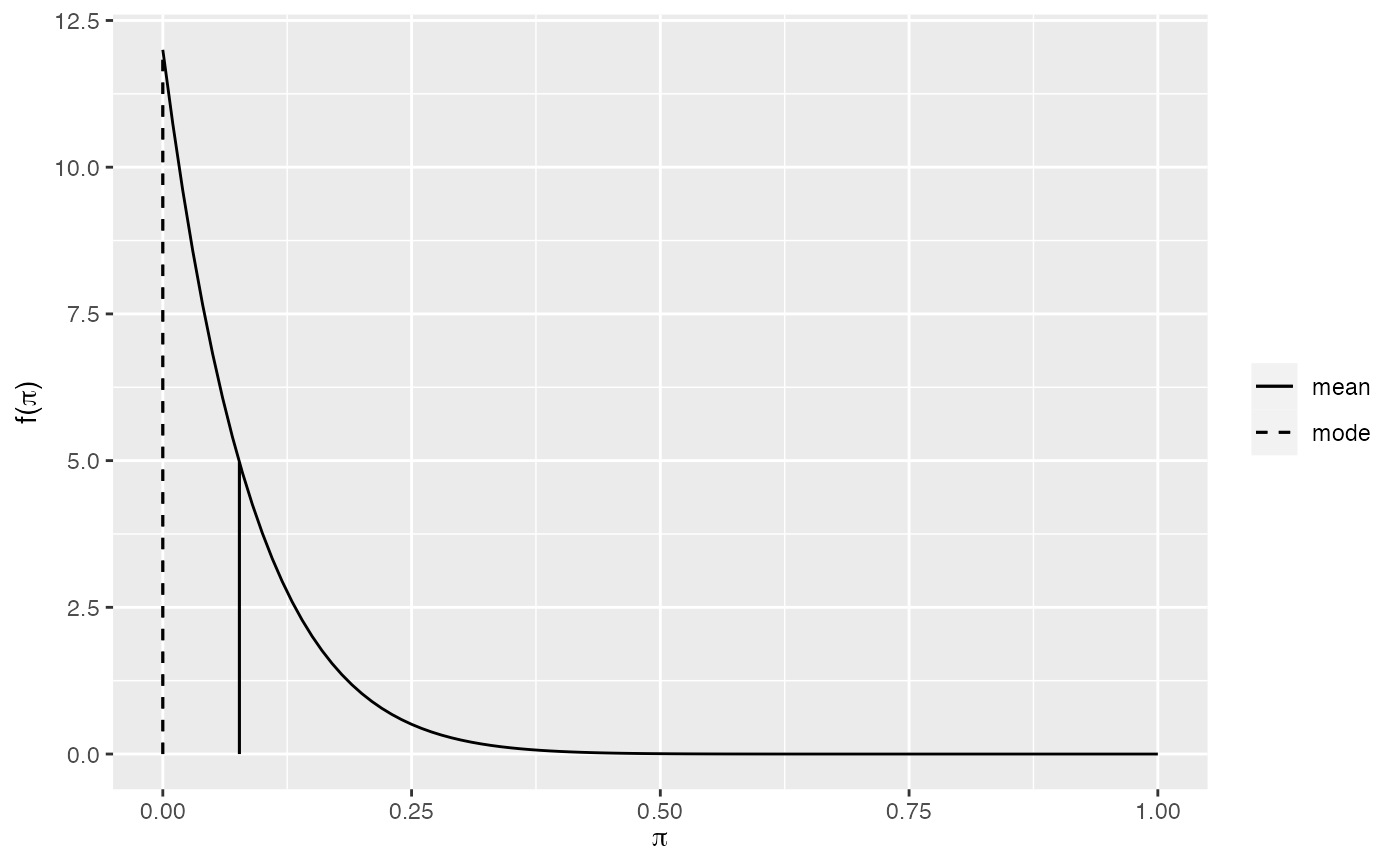
plot_beta(alpha = 1, beta = 12, mean = TRUE, mode = TRUE)
#> Warning: All aesthetics have length 1, but the data has 2 rows.
#> ℹ Please consider using `annotate()` or provide this layer with data containing
#>   a single row.
#> Warning: All aesthetics have length 1, but the data has 2 rows.
#> ℹ Please consider using `annotate()` or provide this layer with data containing
#>   a single row.